A framework to understand the costs of climate action (and inaction)
How might we compare climate-related risks?
 As the impacts of climate change become more evident in our everyday lives, it is critical for central banks, governments, businesses, and civil society groups to have a clear understanding of the multitude of risks they face.
In a new article published in Nature Climate Change, “Near-term transition and longer-term physical climate risks of greenhouse gas emissions pathways,” and a companion slide deck available for download on this page, we built upon the framework of the Taskforce on Climate-Related Financial Disclosures (TCFD), which identifies two broad categories of climate risk:
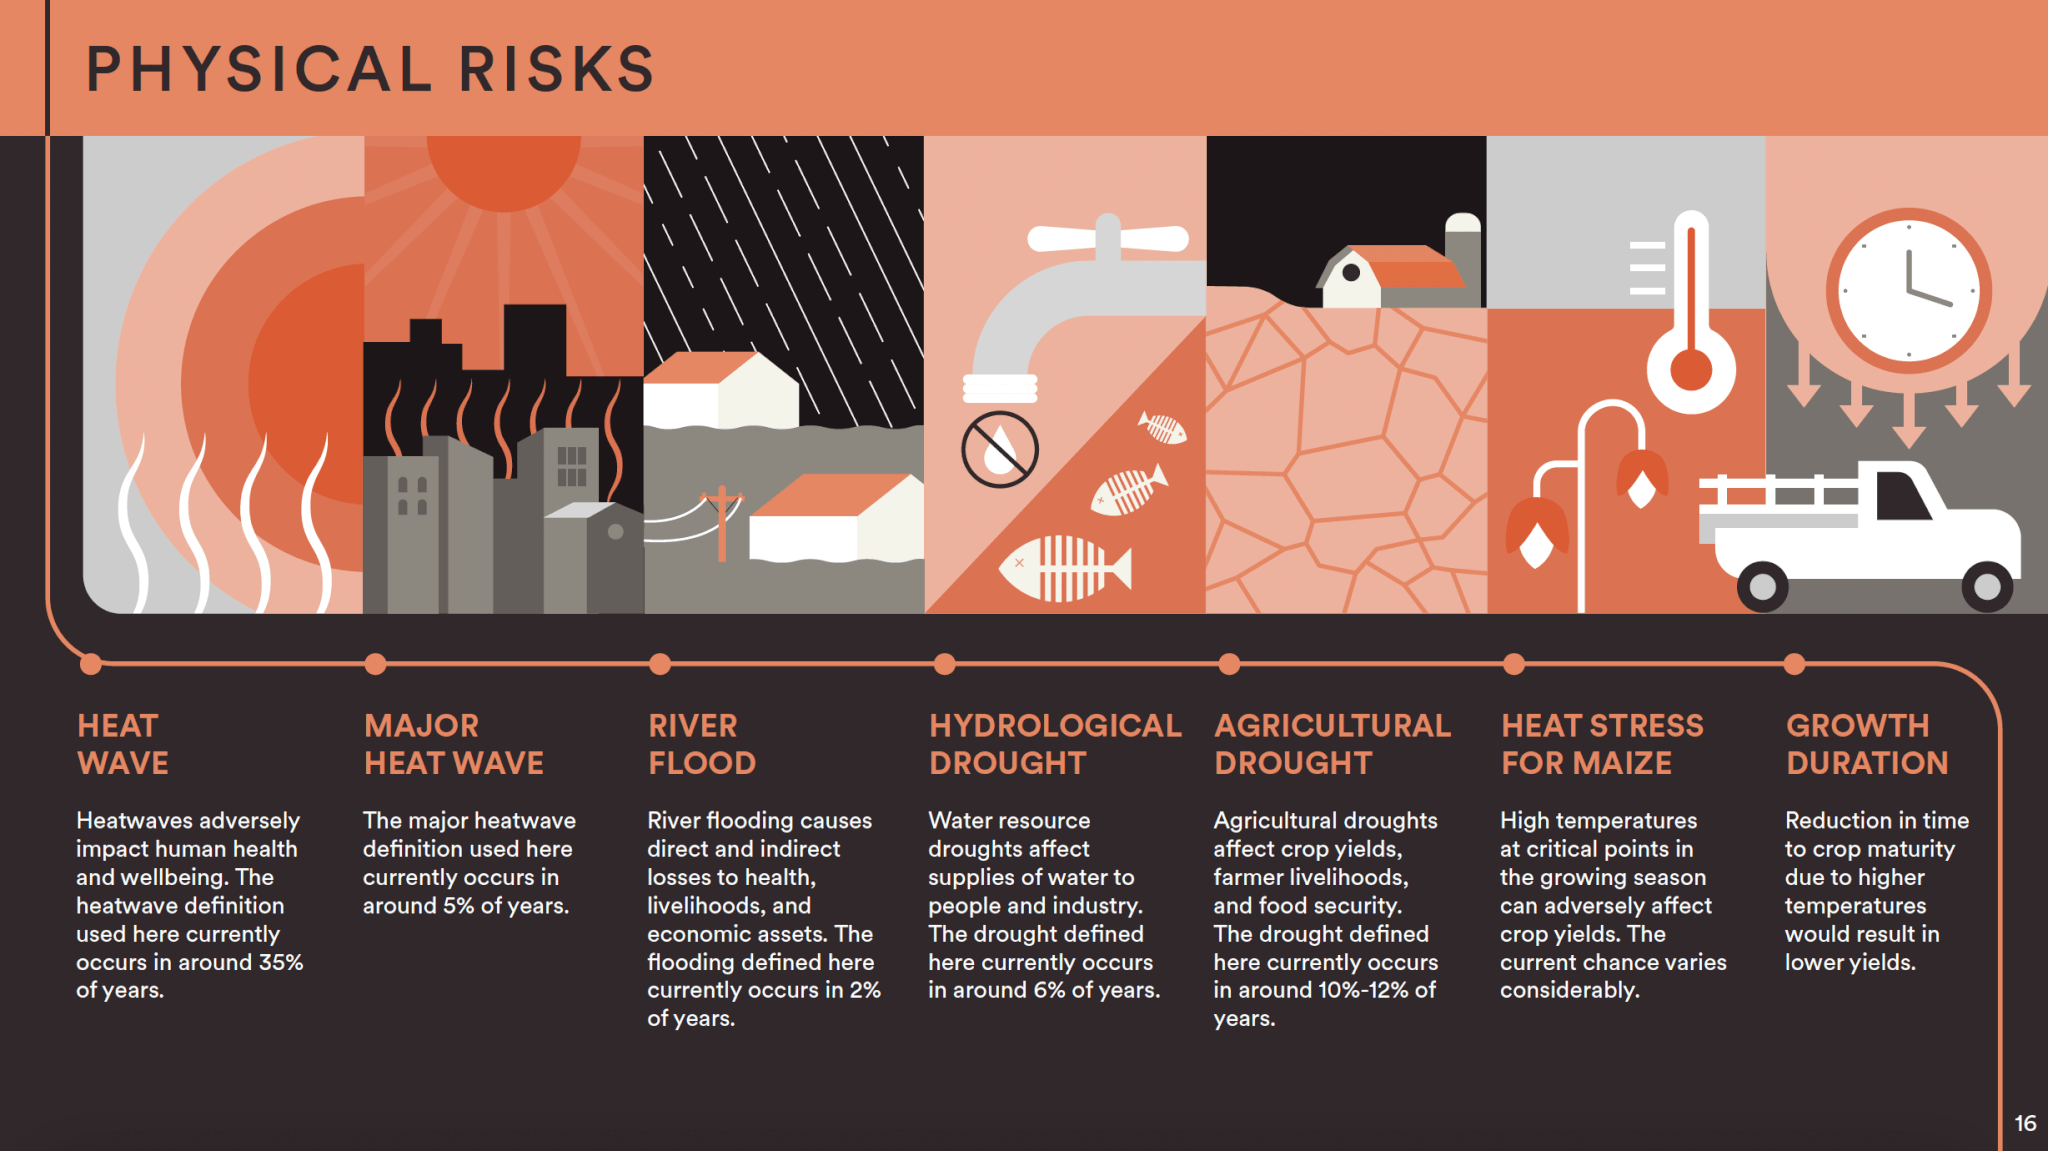
- “Physical” climate risk, or the risks stemming from the climate impacts of a warming world, and
- “Transition” climate risk, or the risks stemming from the shift to a low-carbon economy.
Dating back to the 2006 Stern Review on the Economics of Climate Change, there have been several high-profile attempts to make the case for tackling climate change on the basis that the costs of inaction far outweigh the costs of reducing emissions. Such exercises have come up against obstacles including the difficulty in accurately assessing both the cost of mitigation and the cost of physical climate impacts, as well as the impacts that cannot be expressed monetarily. We simply haven’t had the tools, and in many cases the data, to allow this. Reframing this cost-benefit analysis in terms of a holistic risk analysis is therefore appropriate and timely.
New insights on physical and transition risks
Our new study highlights a number of physical and transition risk-related indicators (see images) for a range of plausible greenhouse gas emissions pathways that lead to approximately 1.5°-4°C of warming by the end of the century. We explore different socio-economic development patterns, different levels of international cooperation and timing toward a coordinated mitigation effort, and different technology preferences, ranging from a focus on renewable energy to a more widespread portfolio of technologies favoring nuclear power and carbon capture and storage. Taken together, our study supplements the climate scenarios developed by the Network for Greening the Financial System with additional scenarios.
![]()
Our framework for showing the potential severity of physical and transition risks allows a comparison of the relevant risk-related metrics in different scenarios, normalizing them to the size of each metric in a central scenario that achieves 2°C of warming. We use 2°C of warming as an effective reference case, a benchmark against which to compare risks of lower (1.5°C) and higher (2.5°-4°C) temperature pathways. We deem it appropriate to use this case as a reference in light of increasing climate ambition globally. We look both at global average risk-related metrics, as well as regionally disaggregated metrics.
Key findings
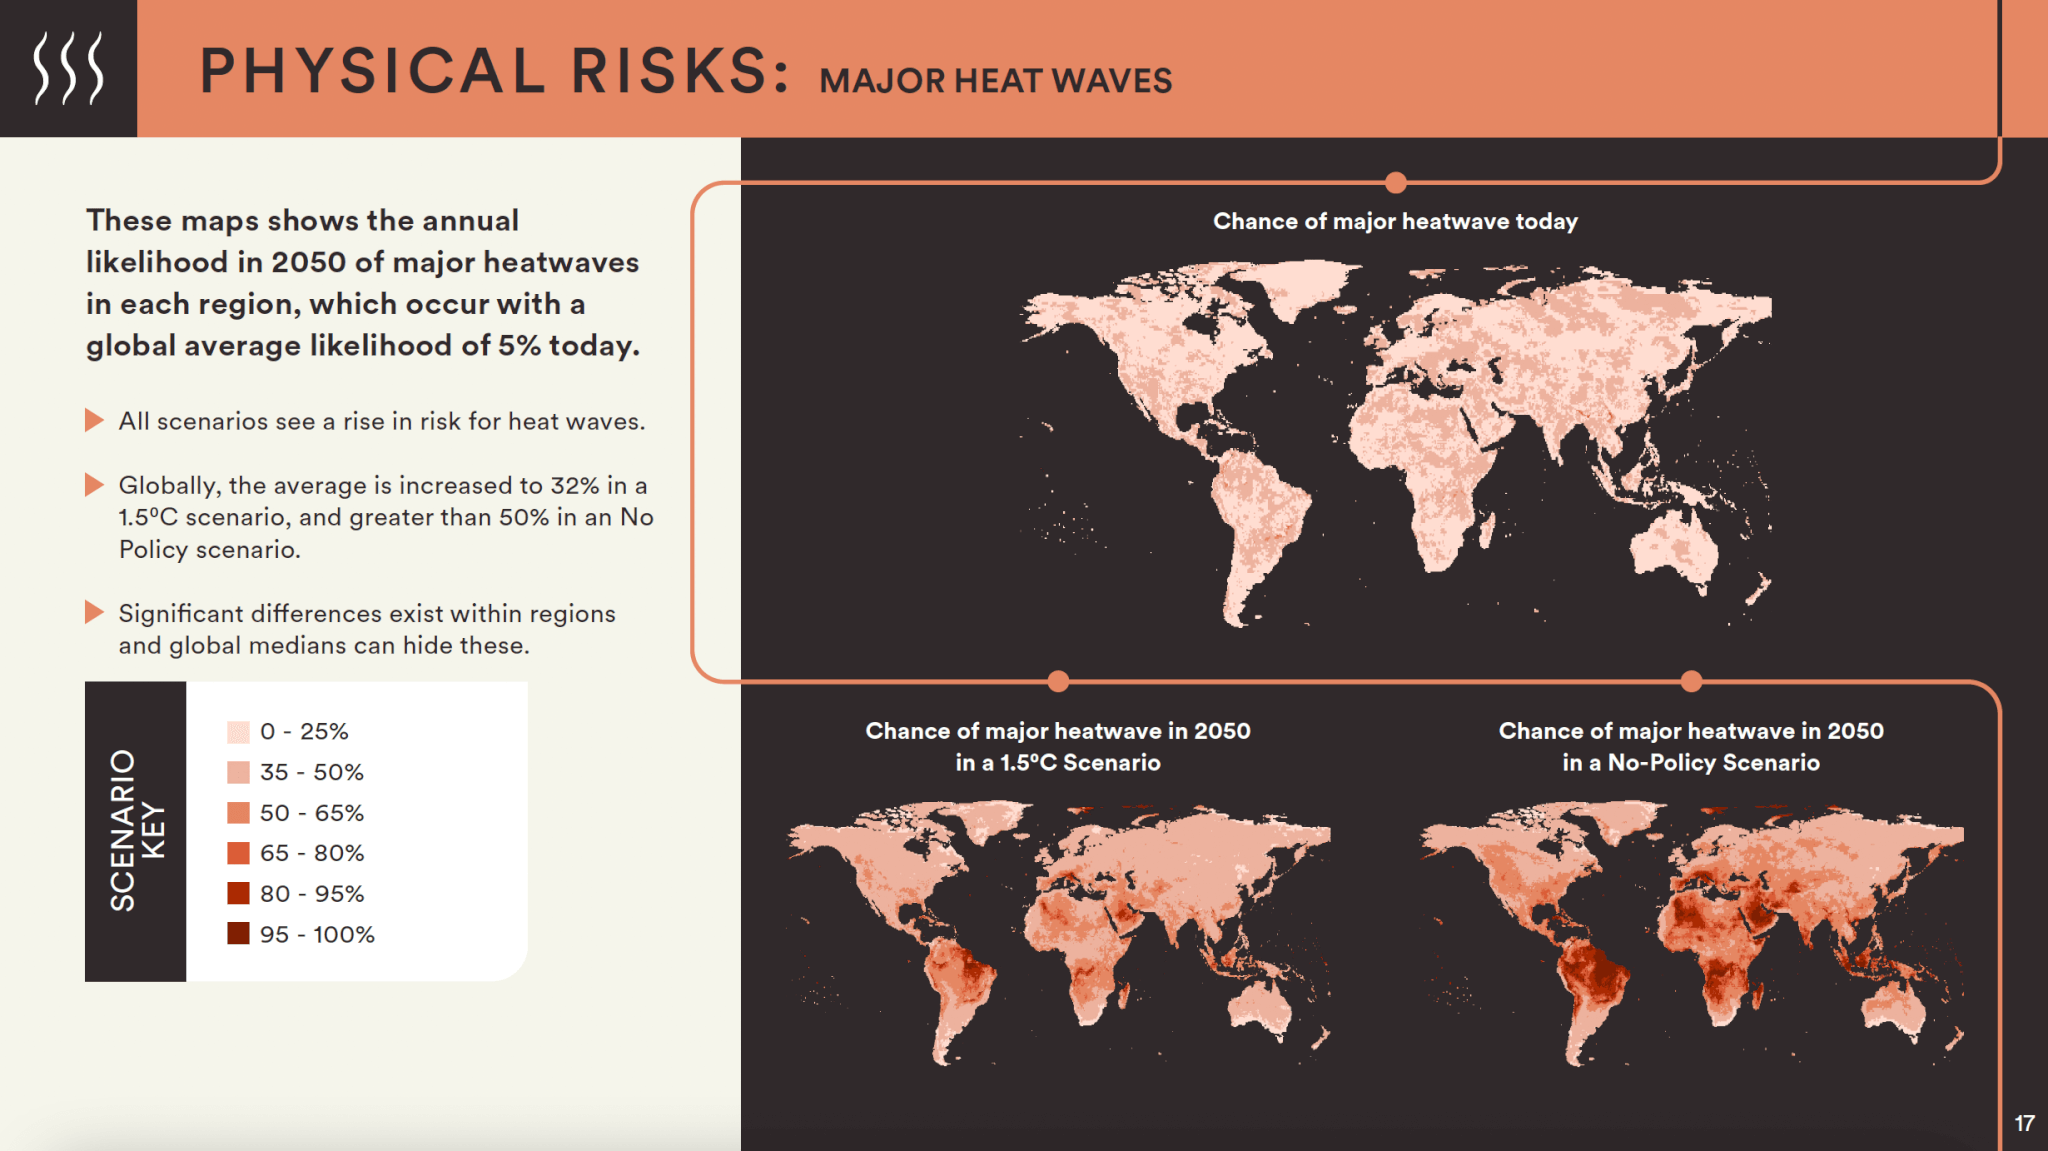
Key physical risk metrics that show particular sensitivity to the global temperature pathway, even as soon as 2050, include the chance of experiencing a major heatwave and three agricultural indicators (maize heat stress; reduction in maize crop growth duration, leading to yield reductions; and agricultural droughts). For example, in a scenario reaching roughly 3°C (associated with countries’ 2015 nationally determined contributions to the Paris Agreement), there would be a 30%-40% greater chance of a major heatwave in most regions by 2050, when compared to a central scenario of 2°C of warming (see figure). Similarly, heat stress for maize would increase by over 50% in key regions like Russia and the EU and U.K., resulting in reductions in maize yield of between 20-30% beyond the central 2°C scenario. By contrast, a scenario with 1.5°C of warming would have an approximately 15% lower chance of major heatwaves, a 10% lower frequency of periods of maize heat stress, and 10% lower reductions in maize growth durations, as compared to a 2°C scenario, when considering global averages.
We also use a variety of metrics related to transition risk, including mitigation costs, carbon prices, reductions in greenhouse gas intensity, fossil fuel demand and coal plant capacity, and electricity and crop prices. At the global level, the scenario with 1.5°C of warming has notably higher values — due to the high level of ambition envisioned in the scenario — than the other scenarios for most metrics. For example, to reach 1.5°C of warming, global abatement costs in 2030 are 1.6% of global GDP, compared to 0.6% in the 2°C scenario. Similarly, carbon prices are around twice as high in the 1.5°C scenario than in the 2°C scenario, but only 25% of the 2°C scenario’s prices in the 2.5°C scenario.
In essence, any scenario and its associated temperature pathway will see a balance between near-term transition risk (which is higher in the lower temperature pathways) and longer-term physical risk (which is reduced in the lower temperature pathways). Our analysis provides a resource for stakeholders to identify how risk levels change for each given temperature scenario, and for each region of interest.
A framework to carry forward
There is still much more work to do to operationalize our framework into a comprehensive model to categorize and calculate actual risks and the associated societal, economic, or financial impacts stemming from them. This includes understanding the social, financial, and political impacts of allowing these risks to materialize. For example, many risks and impediments to a rapid transition to a low-carbon economy could stem from societal resistance, deeply entrenched political-economic norms and institutions, and business models and practices that are not well suited to low-carbon technologies and behaviors. It’s also important to understand the potential for individual risks to interact and cascade, the systemic implications of this happening, and the range of mitigation actions available to reduce or avoid these risks. But our analytical framework is an essential first step.
For more reading, see the article in Nature Climate Change and our companion slide deck.