


Understanding the tradeoffs between different solutions can help guide informed decision-making and advance ambitious climate goals.
The future of the climate solutions space is teeming with “what if” questions. What are emissions reduction implications if carbon capture technology accelerates — or fails to materialize? What if the momentum for electric vehicles continues to grow? What if biofuels suddenly take off?
To advance a research agenda that addresses these and other similar questions, we partnered with the Pacific Northwest National Laboratory (PNNL) to model a panorama of “what if” questions using constraint scenarios — 16 so far with more planned — using data from the Global Change Assessment Model (GCAM). These scenarios form the basis of our report Achieving global climate goals by 2050: Pathways to a 1.5° C future, which follows an inaugural 2020 report.
The Central and Ensemble scenarios
This year’s report introduces for the first time an Ensemble of scenarios, which allows us to test the robustness of the assumptions in an anchoring Central scenario. In these scenarios, we attempted to identify parameters that would limit global temperature change to 1.5o C by 2100 with limited overshoot, which is in line with the Paris Agreement and used in IPCC Working Group III scenario definition. We rank from six parameters “zero” to “low” to “medium” to “high” (Figure 1) using various criteria (behavioral or lifestyle contributions are held constant as a parameter):
- Bioenergy
- Carbon capture and sequestration (CCS)
- Technological carbon dioxide removal including react air capture (CDR & DAC)
- Electrification of road transport
- Nuclear generation
- Renewable energy
With CSS, for example, a “zero” on the scale would mean there is no carbon capture technology on the market, whereas “high” indicates that the cost of the technology is 20% more affordable than predicted. More information on the scaling can be found in the technical summary of the same report.
While we use the Central Scenario as an anchor in much of our analyses, we recognize that the future of climate change mitigation efforts is consumed by important “what if” questions. We account for these uncertainties in the ClimateWorks Scenario Ensemble, or “Ensemble” for short — which helps us answer these essential “what if” questions.
Figure 1: Modeling parameters for Central and Ensemble scenarios
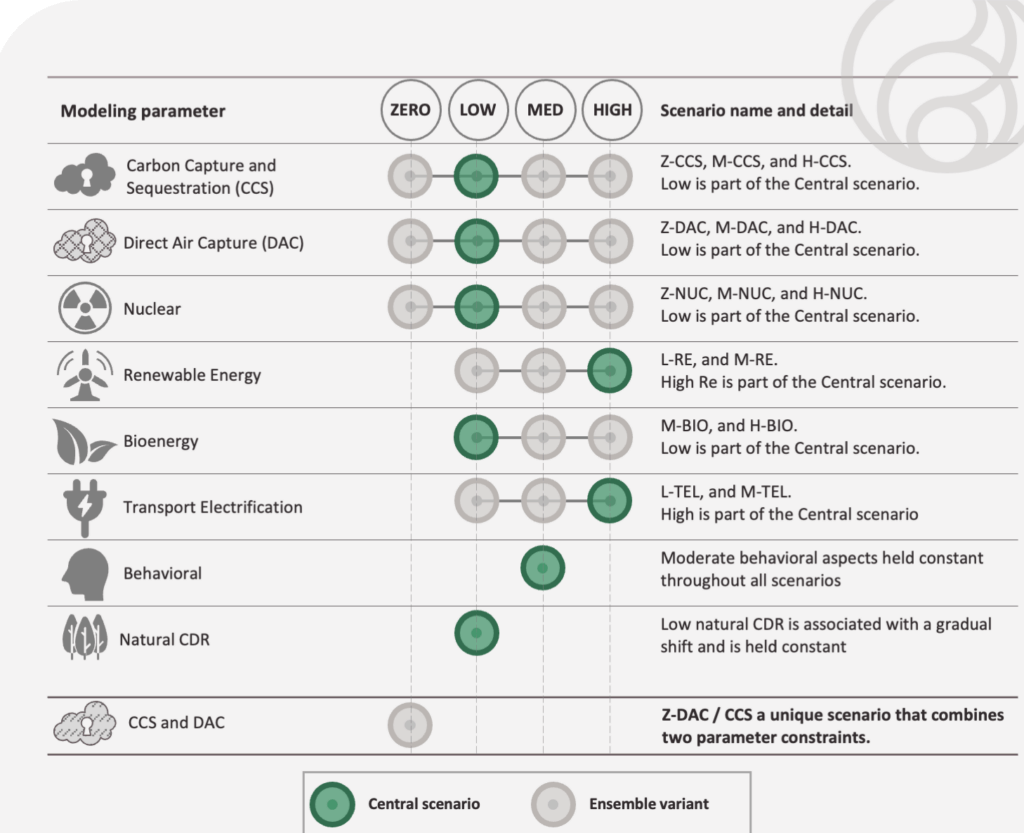
To obtain various outcomes for our Ensemble, we hold the parameters and levels of the Central scenario constant while modifying one component at a time. This is often referred to as constraint analysis. In this case, we are turning the dial up or down, thus incentivizing or constraining the deployment of specific mitigation options or underlying access to certain types of energy.
Answering essential “what if” questions about climate solutions
By using constraint analysis, we can start to answer essential “what if” questions about potential climate change mitigation pathways. For example, what if we are only able to mobilize low levels of transport electrification rather than high levels? These lower levels of electrification might represent a failure to scale electric vehicle options due to either a materials constraint or failure of policy ambition, which would need to be made up elsewhere in order to maintain a similarly stringent emissions pathway. We can then identify appropriate tradeoffs, like increasing productivity measures, electrification, and efficiency options. We discuss these transportation interactions in more detail in another blog post.
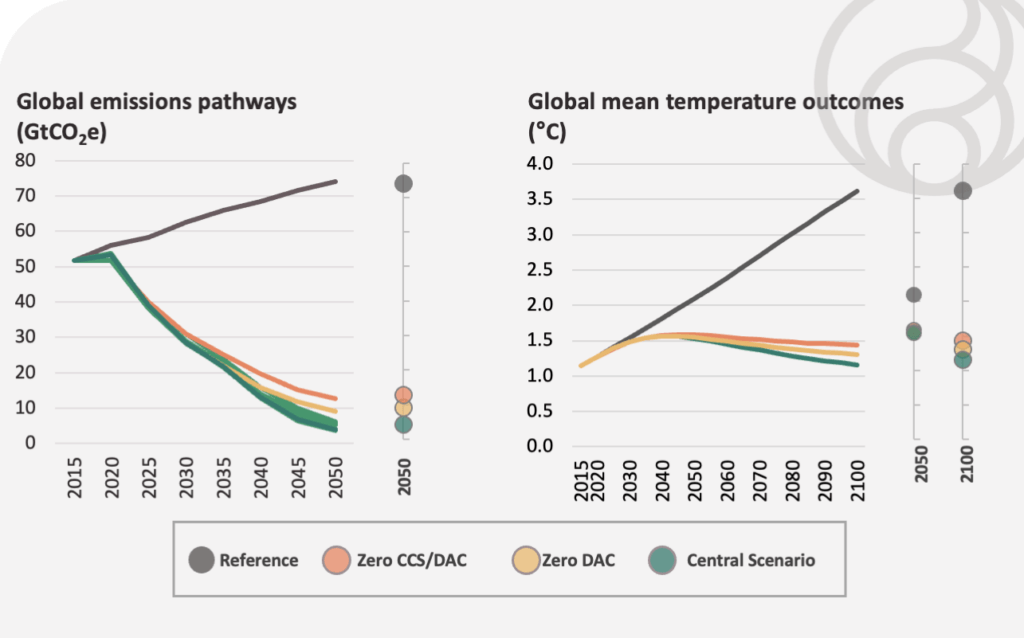
The Ensemble helps us answer a second important “what-if” question: what if we fail to implement carbon dioxide removal (CDR) technologies in the form of carbon capture and sequestration (CCS) and direct air capture (DAC)? A Zero-CCS/DAC scenario triggers one of the greatest challenges for the model in maintaining a stringent emissions pathway. If carbon dioxide sequestering technologies fail, our ability to meet stringent temperature targets becomes ever more difficult to achieve (Figure 2). Our understanding is that with a slower and tepid effort to reduce emissions, we increase our reliance on technologies associated with carbon dioxide removal in the future if we maintain 1.5° C as the ultimate goal. And if these technologies fail to materialize, the probability of reigning in temperature rise becomes more uncertain.
Figure 2: Global emissions pathways and temperature outcomes
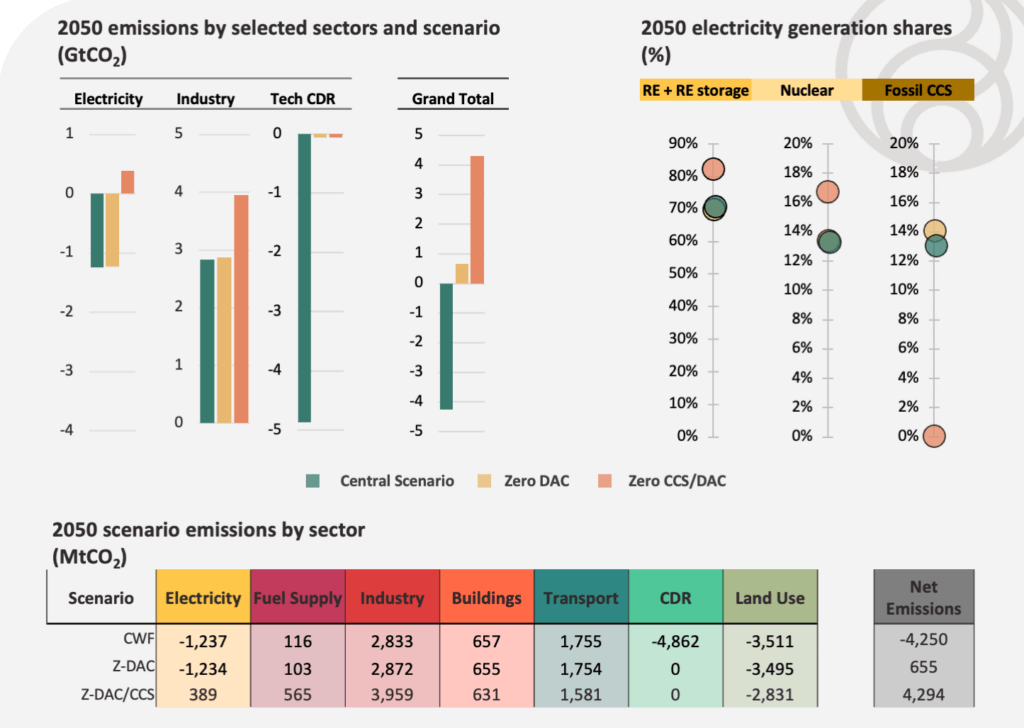
By considering 2050 projections for emissions and electricity generation shares, we can see a notable difference between scenarios depending on whether they incorporate CCS and DAC — especially when it comes to the three sectors of electricity, industry, and technological CDR (Figure 3).
Figure 3: Comparing Central, Zero DAC, and Zero/CCS DAC scenarios based on2050 emissions and electricity generation shares
Yet another important example involves the role of bioenergy. Fuels derived from bioenergy are assumed to produce lower emissions because they utilize plants’ natural carbon-sequestering ability. Plants take carbon dioxide out of the air and the burning of the fuels puts the carbon dioxide back. Thus, depending on the processing and distribution of these fuels, bioenergy is considered far lower in emissions in comparison to fossil fuels.
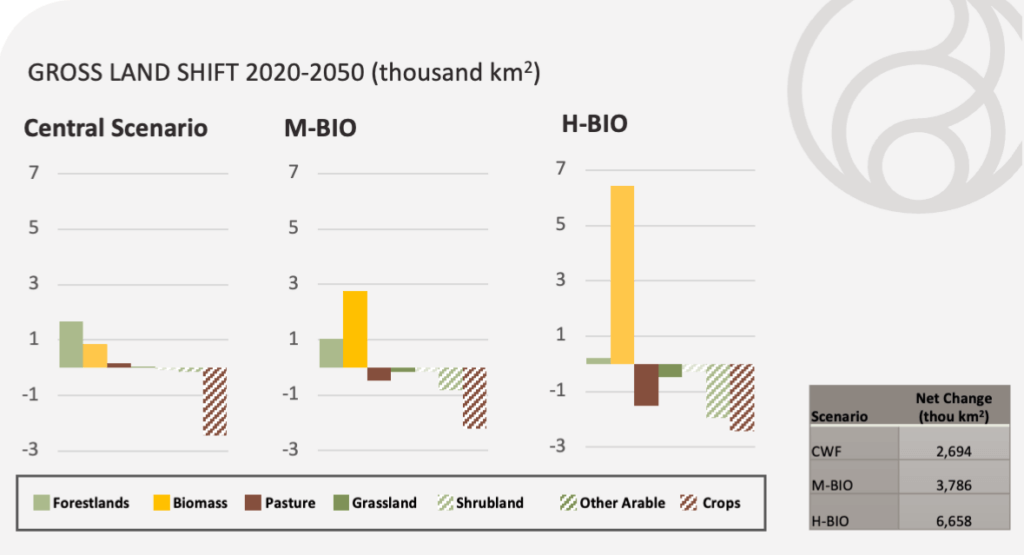
What if bioenergy were scaled? While our Central scenario has a low bioenergy constraint (defined as 100 EJ of primary energy by 2100), we also developed a Medium and High scenario (defined as a max of 150 EJ for the Medium and over 200 EJ of primary energy in the High scenario). And while such scaling of this energy can be beneficial in reducing emissions of key sectors, the impacts on land use can be quite dramatic. As shown in Figure 4, net land reallocations climb in each of these scenarios, and in the High scenario, there is more than 6 million km2 of dedicated biomass production by 2050, equivalent to twice the landmass of India. This would have a huge impact on the competition over land and raise concerns around biodiversity. This means that while bioenergy has a role to play, it is worth considering constraints given the large potential impacts of scaling its use.
Figure 4: Land shift implications of scaling bioenergy
Potential areas for future analysis and exploration
As shown in the previous visuals, the Ensemble gives us a more comprehensive understanding of potential future scenarios given changes and constraints across different geographies and sectors. This allows us to better inform and support our responses to the many “what if” questions posed or those that might come up in the future. Having this data available also allows us to explore the co-benefits of pursuing differing mitigation options. An Ensemble provides essential knowledge and strategies and invites further engagement, curiosity, and collaboration for solutions.
As climate change technologies evolve and new challenges arise, we continue to pose “what if” questions in our work and to test the relevancy of our assumptions. Funders can use this data to help guide their decision-making. In a world full of “what if” questions, our Ensemble can help pave a path toward informed and ambitious climate philanthropy.
This journey is ongoing: we intend to update and expand our Ensemble with additional scenarios in the near future, consulting with the philanthropic community on potential areas of interest. We are already exploring several new topics, including the role of green hydrogen, the potential of limited and/or ambitious lifestyle changes in terms of energy use and dietary shifts, and the inclusion of a wider array of CDR options. With your help, we hope to answer the most important climate question: what if we start taking bold climate action right now?
Download the full report, Achieving global climate goals by 2050: Pathways to a 1.5° C future, to read about important “what if” questions and more. The full report explains the Ensemble results per sector, gas, and geography in further detail. Additionally, ClimateWorks has, for the first time, made publicly available the data that underlines the creation of the report, which contains a file of our GCAM-CWF Ensemble. We hope these data can serve as a helpful resource for users to further explore these scenarios.
Contact ClimateWorks to learn more about climate change mitigation opportunities, how to develop a climate strategy, and how we model our scenarios.
Special thank you to Majlis Walker for providing editorial support for this article.


